CC BY 4.0 · CERN-OHL-P 2.0 · CC BY-SA 4.0

Open-source IV drip flow monitor for pediatric humanitarian care.

A standalone, battery-powered device that counts individual drops with two infrared beams, infers volumetric flow from drop transit time, and alarms when delivery deviates from the prescribed rate.

Snapshot · v1.0.0 · 2026-05-14 DOI · 10.5281/zenodo.20199232
The problem

Pediatric IV delivery is silently dangerous in low-resource settings.

Gravity-fed IV drips are the default in humanitarian and rural healthcare. Without an infusion pump, flow rate is set by hand-counted drops — and a single missed adjustment can deliver a fatal volume to a child in under an hour.

Source: NICE NG29 — Intravenous fluid therapy in children and young people in hospital
CHF 11
estimated component BOM at qty=1000 (first-prototype unit ≈ CHF 33). Compatible with any standard IV drip set — macro (10 / 15 / 20 gtt·mL⁻¹) and micro (60 gtt·mL⁻¹).
119 days
design-target standby on a single alkaline AA cell (Phase 2 sleep + comparator wake, Rev-C). Rev-B firmware today runs ~19 h actively-monitoring before swap. Field-deployable in clinics without reliable mains or USB charging.
73 %
of surveyed Sub-Saharan African neonatal facilities lack reliable infusion-pump access (none or limited). Manual gravity drip is the default — flow set by hand-counting drops, no electronic monitoring.
Architecture

Dual-beam optical drop detection.

Two IR beams cross the drop path inside the drip chamber, vertically separated by 10.0 mm. Each drop yields two independent measurements per crossing: the shadow duration τ — how long the drop occludes a beam — sets the drop's diameter, and the inter-beam transit Δt sets its velocity. Volume follows from a sphere model; flow rate is the product of per-drop volume and drip cadence — independent of the drip-set's nominal gtt·mL⁻¹ rating.

30 dpm
D1 D2 10 mm
Per-beam shadow simulated
τ_TOP— ms
τ_BOT— ms
Δt — ms
Inferred (sphere model)
v_drop— m·s⁻¹
d_drop— mm
V_drop— µL
Calibration — / 5
Flow rate dual-beam
— mL·hr⁻¹
Live trace · last 30 drops
+15% −15%
Drop event timeline · maps drop position to comparator timestamps — ms
τ_TOP
Δt
τ_BOT
spawn D1 enter D2 enter D2 exit

Why two beams instead of one.

A single-beam counter equates volume with count × set-factor (gtt·mL⁻¹). That assumption fails the moment fluid viscosity, surface tension, or chamber wear deviate from the manufacturer specification — exactly the conditions of a humanitarian deployment. By measuring drop velocity directly, the device is set-agnostic.

Single-beam
count × set-factor
mL·hr⁻¹
Dual-beam
measured V × dpm
mL·hr⁻¹
Divergence

Two-phase detection.

Phase 1 (active): ADC polling on both photodiodes; threshold crossing emits a drop event with both timestamps. Used during alarm-armed delivery.

Phase 2 (low-power): COMP1 + LPTIM1 stop-mode pairing; the MCU sleeps between drops and is woken by the comparator. Idle current target ~6 µA. Single-AA runtime target ≥ 14 days continuous monitoring (full-load bench measurement pending — see power tree).

Predicted power · P1 active
Total at 3.3 V rail — µA
Alkaline-AA runtime * — days
Predicted, not bench-measured. Field-power-chain validation deferred to Rev-C (see §7 Limitations). Real boost-converter efficiency drops at light loads, so the P2 runtime estimate may be 10–20 % optimistic.
Assumptions used in this calculation
  • Alkaline AA at 2 500 mAh × 1.5 V = 3 750 mWh raw; 80 % average TPS610981 boost efficiency → 3 000 mWh usable on the 3.3 V rail.
  • IR LED drive: IF = (3.3 − 1.2 V) / 100 Ω = 21 mA per LED, fixed by R1/R4.
  • Phase 1 (Rev-B today): both LEDs continuously on (TIM1_CH2 PWM 100 % duty for TOP, static GPIO high for BOT); STM32G071 active polling at 32 MHz with peripherals on (~3.0 mA).
  • Phase 2 (Rev-C target, peripherals initialised but unused in Rev-B): TOP only at 0.28 % duty (5 µs ON / 1.80 ms); STM32G071 Stop1 with COMP1 + RTC wake (~2 µA).
  • DOGS164W-A LCD: 250 µA continuous in both phases — cannot be turned off because the clinician must see the flow rate.
  • Photodiode bias: 1 mA pull-up current when LED on, scaled by LED duty cycle and channel count.
  • COMP1, boost-quiescent, ADC_V_BAT divider, gate pull-ups: grouped as ~5 µA misc.

Read the first-principles derivation →

Tate's Law why drop sizes are repeatable for a given fluid and orifice

A drop hangs from the chamber outlet until the gravitational force on its accumulated mass exceeds the surface-tension force holding it to the rim. At that instant it detaches. Tate's Law (Tate, 1864) sets the balance:

m · g = 2π · r · γ

where m is drop mass, r the outlet radius, and γ the fluid's surface tension. Substituting m = ρ V gives the predicted drop volume:

V = (2π · r · γ) ⁄ (ρ · g)

Real drops detach slightly before the rim, so the prediction is scaled by a dimensionless Harkins–Brown factor F (typically 0.6–0.95, depending on r/V1/3):

V = F · (2π · r · γ) ⁄ (ρ · g)

For 0.9 % saline (γ ≈ 73 mN·m⁻¹, ρ ≈ 1005 kg·m⁻³) through a macro-20 outlet (r ≈ 1.5 mm, F ≈ 0.8), Tate's prediction is V ≈ 56 µL — close to the manufacturer's nominal 50 µL/drop (1 mL ÷ 20 gtt) only because the outlet was engineered around water-like fluids.

Why it matters here. Tate's prediction holds for the fluid and outlet the manufacturer assumed; field deployments routinely violate both — blood has higher γ, IV medications change ρ, and re-used sets wear. The dual-beam architecture exists to measure the actual drop diameter from the shadow duration rather than trust the gtt·mL⁻¹ rating: d = v · τ, then V = (4/3)π(d/2)3.

Drop-volume algorithm how Phase 1 turns four timestamps per drop into a calibrated volume

Rev-B vs Rev-C scope. Below is the intended dual-beam algorithm. Rev-B firmware implements steps 1–6; Phase 2 (step 7) is a Rev-C target. The V_CAL_K = 1.27 scalar applied after Step 6 corrects the systematic chord-sphere under-prediction surfaced in bench validation — see Limitations §17 for the residual error sources and position-dependence ceiling.

Phase 1 runs both IR beams simultaneously for the first ~10 drops of a session. Each drop emits two falling/rising edge pairs at the comparator, giving four timestamps per drop:

tT,in — leading edge enters TOP beam (falling edge)
tT,out — trailing edge exits TOP beam (rising edge)
tB,in — leading edge enters BOT beam (falling edge)
tB,out — trailing edge exits BOT beam (rising edge)

1. Inter-beam transit. Falling-edge to falling-edge:

Δt = tB,intT,in

2. TOP-beam shadow duration. The leading edge enters then the trailing edge exits:

τTOP = tT,outtT,in

3. Gravity-corrected velocity. The drop accelerates over the 10 mm beam pitch, so a naive v = Lt would overestimate the velocity at the TOP beam. Treat the drop in free fall and solve L = vTOP·Δt + ½gΔt2 for vTOP:

vTOP = L⁄Δt − ½ g · Δt

At Δt = 19.4 ms (typical for a macro-20 set), the gravity correction is ~0.10 m·s⁻¹ — a 22 % adjustment that's worth doing. vBOT = vTOP + g·Δt follows for free if needed.

4. Drop diameter from the TOP-beam shadow.

d = vTOP · τTOP

Using τTOP rather than τBOT locks the diameter in from the drop's first beam crossing (lower noise floor — the LED current is steadier earlier in the comparator-armed window).

5. Per-drop volume from the sphere model.

Vi = (4⁄3)π · (d⁄2)3

6. Trimmed-mean calibration. After ten drops, sort the ten Vi samples ascending, discard the smallest and largest (protects against one bad drop — bubble, gross misalignment, ringing), and average the middle eight:

Vcal = (1⁄8) · Σi=29 V(i)

7. Phase 2 — count, don't measure (Rev-C target). The Rev-C design has the MCU sleep in Stop mode between drops; LPTIM1 pulses the IR LED at 5 µs ON / 1.8 ms (~0.3 % duty), and COMP1 wakes the core only when the LED is lit AND a drop is in the beam. Each wake counts as one drop event. Flow rate displayed to the clinician is the running rolling sum:

Q = (drops in window) · Vcal ⁄ window

Why this works (in principle). The dual-beam architecture finds the per-session constant Vcal in ten drops; once found, Phase 2 reduces to counting. Bench validation showed that in practice the ratio K = Vtrue ⁄ Vest spans 0.42–1.98 across mount positions — the position-dependence finding (Limitations §17) is the live ceiling on this approach.
Hardware

Board architecture.

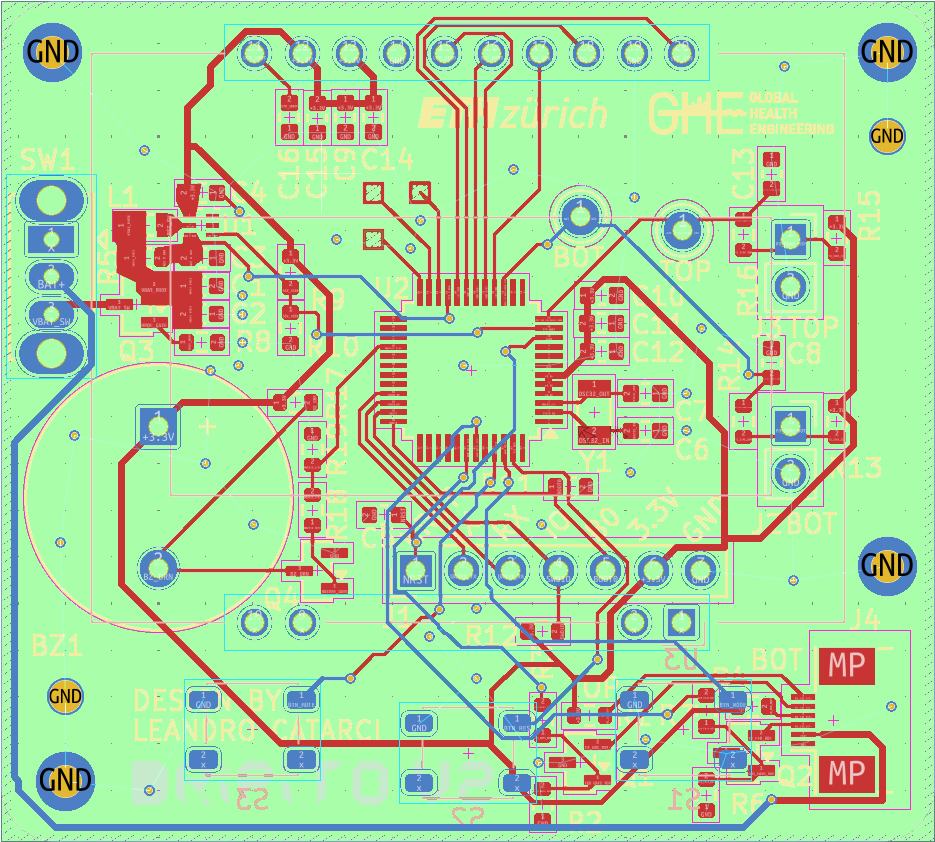
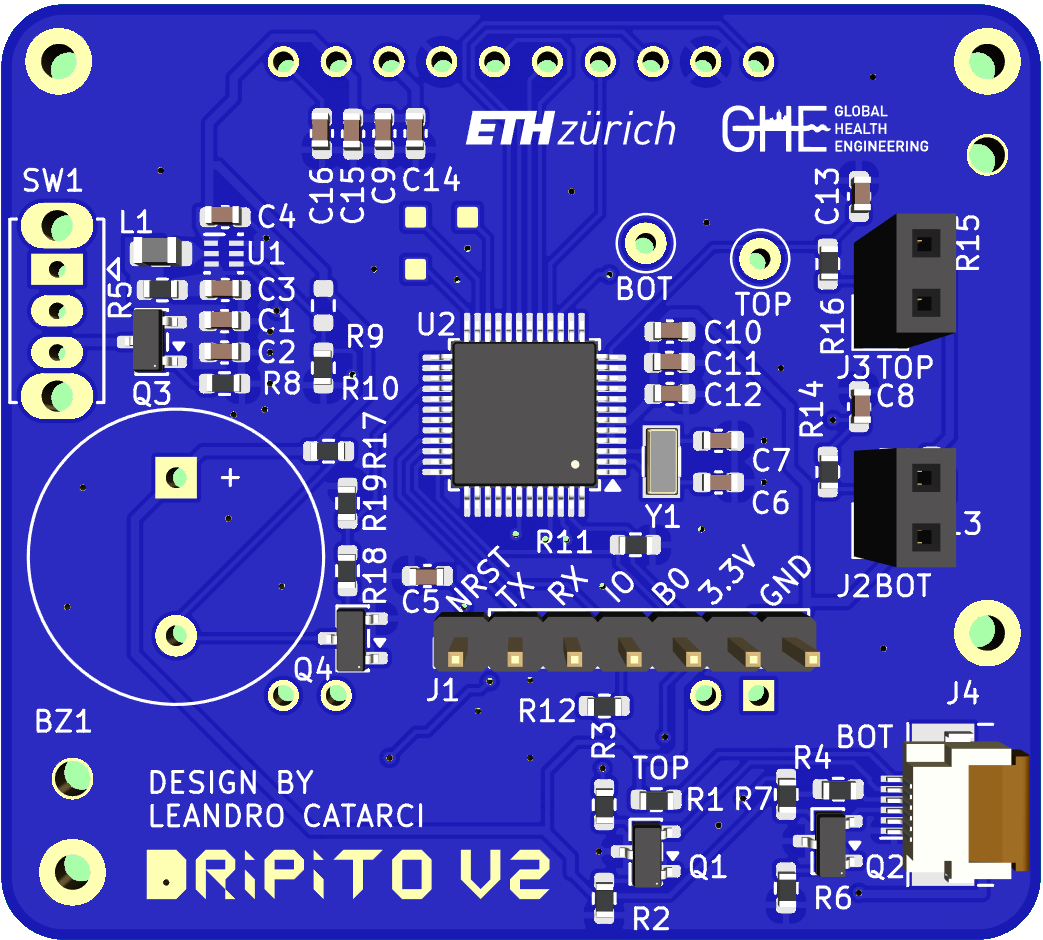
A 50 × 45 mm 2-layer board, hand-solderable for low-volume humanitarian assembly. Back side (STM-side) shown. Click any numbered callout for the schematic snippet, the rationale, and the ADR that locked the decision.

Dripito V2 PCB · top side · KiCad 3D render
50 × 45 mm · 2-layer · F.Cu shown · 3× display scale
Hotspot 1 · MCU

STM32G071C8T6 · core + decoupling

[ KiCad schematic snippet ]

48-pin LQFP, single 3.3 V rail with 4× 100 nF decoupling. Migrated from STM32G030 → G031 → G071 because G030/G031 lack COMP1 and the DAC required for the threshold reference. Pin-compatible swap, no layout cost.

Reproduce

Build it yourself.

Assembly instructions

Single Docker command regenerates every figure in this page from the raw CSVs (Zenodo deposit pending mint). Hardware files are KiCad 8 native; firmware builds on STM32CubeIDE 1.16; enclosure prints in ASA on a 0.4 mm nozzle.

Bill of materials

Ref Description MPN Qty USD · qty 1 USD · qty 1000
U2 STM32G071C8T6 Cortex-M0+ MCU IC STM32G071C8T6 1 1.65 0.83
U1 TPS610981DSET 1.5-to-3.3V boost IC TPS610981DSET 1 1.12 0.61
U3 EA DOGS164W-A 4x16 transflective LCD Display EA DOGS164W-A 1 7.17 4.30
Y1 32.768 kHz LSE crystal Crystal X321532768KGD2SI 1 0.20 0.12
Q3 AO3401A P-channel MOSFET Transistor AO3401A 1 0.03 0.02
BZ1 SFN-1407PA7.6 piezo buzzer Audio SFN-1407PA7.6 1 0.06 0.04
L1 LQM21PN4R7MGRD 4.7 uH boost inductor Inductor LQM21PN4R7MGRD 1 0.06 0.04
C1 10 uF GRM188R60J106ME47D Capacitor GRM188R60J106ME47D 1 0.01 0.01
TP1+TP2 Keystone 5000 miniature test point Test point 5000 2 0.27 0.15
J4 FPC-05F-6PH20 6-pin 0.5 mm FFC socket Connector FPC-05F-6PH20 1 0.08 0.06
SW1 SK12D07VG5 SPDT slide switch Switch SK12D07VG5 1 0.02 0.02
S1+S2+S3 PTS647SN38 tactile switch (Reset/Mode/Mute) Switch PTS647SN38SMTR2 LFS 3 0.20 0.13
J1 PM254-1-07-Z-8.5 7-pin header Connector PM254-1-07-Z-8.5 1 0.12 0.07
C3 100 nF GCM188R71H104KA57D (HF) Capacitor GCM188R71H104KA57D 1 0.01 0.01
C5+C9+C10+C12+C14 0.1 uF CL10B104KB8NNNC decoupling Capacitor CL10B104KB8NNNC 5 0.00 0.00
C2 100 nF CL10B104KA8NNNC Capacitor CL10B104KA8NNNC 1 0.00 0.00
J2+J3 2.54 mm 1x2 photodiode socket Connector 2.54-1*2P母 2 0.04 0.03
R5 390 Ohm RC0603JR-07390RL Resistor RC0603JR-07390RL 1 0.00 0.00
C8+C13 100 pF CL10C101JB8NNNC Capacitor CL10C101JB8NNNC 2 0.00 0.00
R13+R15 3.3 kOhm 0603WAF3301T5E Resistor 0603WAF3301T5E 2 0.00 0.00
C15 4.7 uF CL10A475KO8NNNC Capacitor CL10A475KO8NNNC 1 0.01 0.01
Q1+Q2+Q4 2N7002 N-MOSFET Transistor 2N7002 3 0.01 0.01
C6+C7 20 pF CL10C200JB8NNNC LSE load Capacitor CL10C200JB8NNNC 2 0.00 0.00
R1+R3+R4+R7+R14+R16+R18 100 Ohm 0603WAF1000T5E Resistor 0603WAF1000T5E 7 0.00 0.00
R17 1.8 kOhm 0603WAF1801T5E Resistor 0603WAF1801T5E 1 0.00 0.00
C4 22 uF CL10A226MQ8NRNC bulk Capacitor CL10A226MQ8NRNC 1 0.01 0.01
C11+C16 1 uF CL10A105KB8NNNC Capacitor CL10A105KB8NNNC 2 0.00 0.00
R11+R12+R19 10 kOhm 0603WAF1002T5E Resistor 0603WAF1002T5E 3 0.00 0.00
R2+R6+R8+R10 100 kOhm 0603WAF1003T5E Resistor 0603WAF1003T5E 4 0.00 0.00
JLCPCB 50x45 mm 2-layer (qty=5 order $3.10 / 5) Fabrication 1 0.62 0.30
Subtotal · Main PCB $12.48 $7.27
D1+D2 BPV10NF IR photodiode (TOP+BOT) Photodiode BPV10NF 2 0.64 0.32
LED1+LED2 VSLY5940 940 nm IR LED (TOP + BOT emitters) LED VSLY5940 2 0.90 0.45
Satellite breakout (FFC 6P→2.54mm adapter PCB) Fabrication 1 0.13 0.13
IR LED + photodiode press-fit bezel Optical bezel 4 0.05 0.05
Subtotal · Satellite breakout $3.41 $1.85
"GCT 6-pin 0.5 mm FFC Cable GCT EMEA 1 1.00 0.90
1x AA 1.5V USB-C Li-ion (Alibaba generic) Battery USB-C 1.5V Li-ion AA 1 2.83 1.07
Single AA holder with leads Battery holder 2462 1 1.10 0.50
ASA white FDM (~25 g/device) Filament 1 0.75 0.65
ASA black FDM (~5 g/device) Filament 1 0.15 0.13
Subtotal · Mechanical · battery · filament $5.83 $3.25
Estimated unit cost $21.71 $12.37

Component-only BOM — excludes JLCPCB PCBA assembly fees, per-Extended-part surcharges, stencil, and shipping. Including PCBA services and the separately-ordered LCD and tactile switches (hand-soldered from DigiKey), the real per-device build cost at qty=1 = qty=5 ≈ $36.72 USD. The JLCPCB minimum order is 5 boards, so a single-unit reproducer pays the same per-piece price as one building 5.

Source: hardware/bom.csv. PCB qty=1 prices are USD per piece from LCSC retail (matches the JLCPCB PCBA parts-list line totals). Satellite + mechanical qty=1 prices are CHF receipts converted to USD at FX 0.90. qty=1000 prices are estimates: ~50 % of LCSC qty=1 for Extended ICs, unchanged for Basic parts, with documented overrides for fab, holder, and filament. Each estimated row is flagged in its notes column. Rev-C cost-reduction levers live in docs/limitations.md and the open ADRs.

Downloads

Analysis

Predicted accuracy from first principles, before any bench data.

A Monte Carlo error budget propagates measurement uncertainty through the firmware's volume-inversion math to predict per-drop MAPE, Bland-Altman Limits of Agreement, and calibration convergence — committed to git before the validation campaign began. The four headline numbers below are the pre-bench prediction; the Limitations section carries the measured cross-session Bland-Altman so the predict-vs-measure gap is reviewable side-by-side. Source notebook: analysis/notebooks/error_budget.ipynb.

3.1 %
predicted per-drop MAPE, pooled across 20 / 50 / 100 mL·h⁻¹.
±3.87 µL
95 % Limits of Agreement on 50 µL drops, committed to git before any bench data exists.
49 %
of total predicted error attributable to print tolerance on the sensor arm — the dominant Rev-C lever.
2.7 %
V_cal uncertainty at CAL_N = 10 (35 s of calibration time at 50 mL·h⁻¹) — drip-set-CV-limited.

These four numbers were the pre-bench prediction. The MC budget correctly identified print tolerance as the dominant predicted source (1.54 percentage points of the 3.13 % MAPE) but under-estimated the residual ~6×; the gap turns out to be the position-dependent contamination of the chord measurement, visible directly in the raw photodiode waveforms below. The capture firmware (ENABLE_RAW_CAPTURE on the feat/raw-capture-rev-c branch) is not the Rev-B submission firmware; submission firmware = HEAD of v2. See §17 in Limitations for the full architectural treatment.

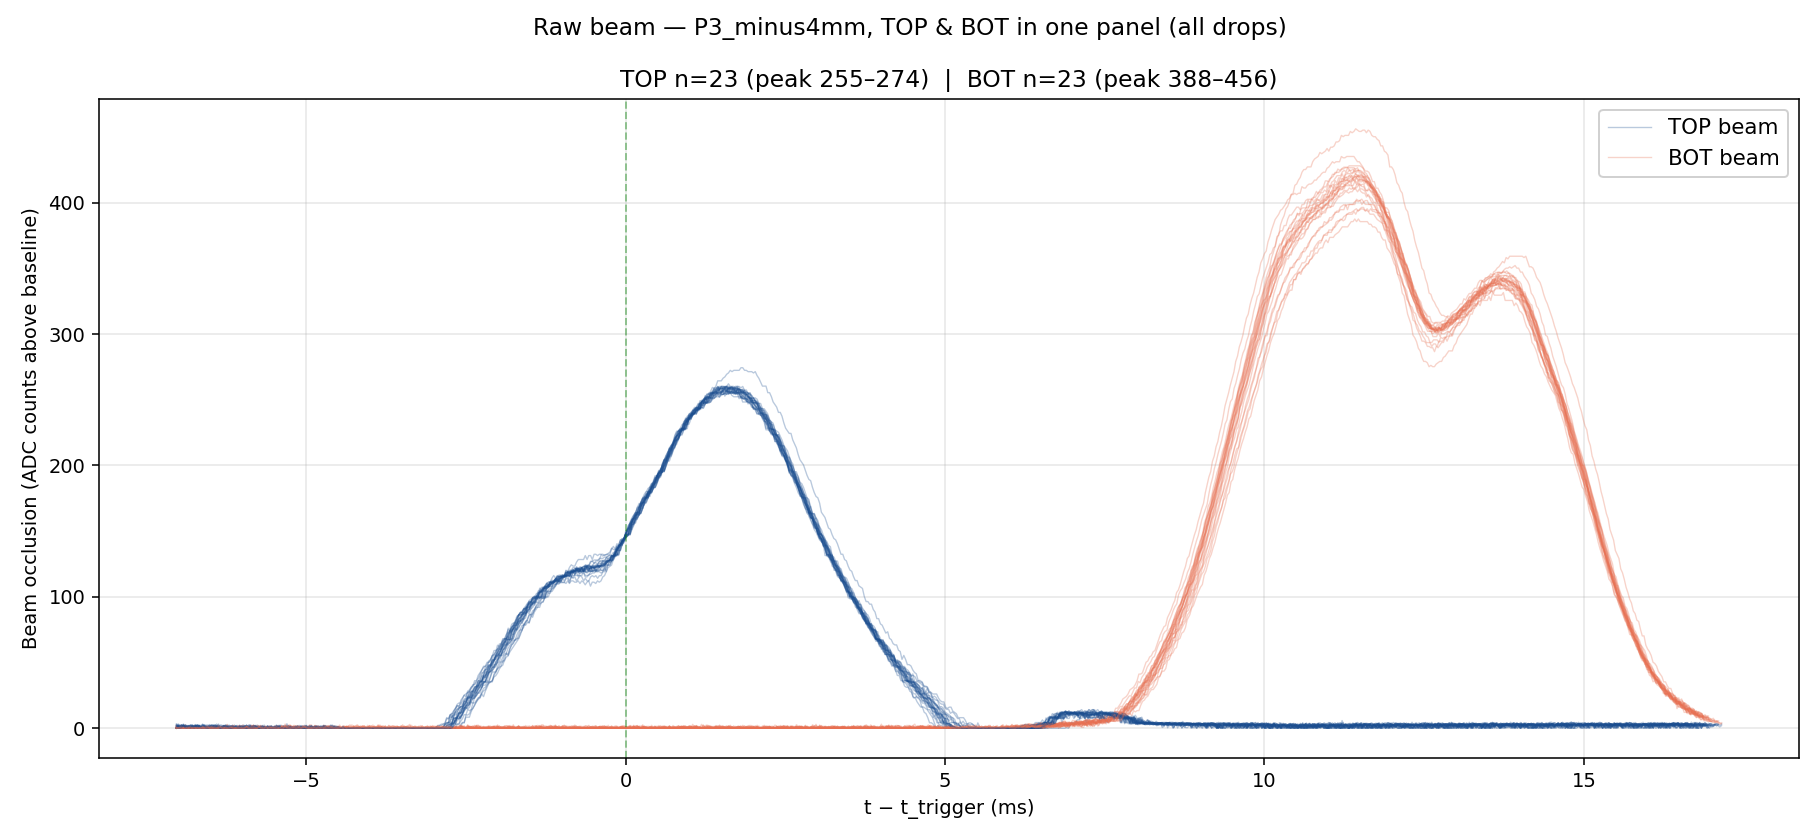
TOP and BOT beam-occlusion waveforms overlaid in a single panel for 23 consecutive drops at mount position P3 (4 mm below canonical). TOP curves (blue) peak around +2 ms after the trigger anchor with a small secondary shoulder approaching from negative time. BOT curves (orange) peak around +11 ms with a bifurcated structure showing a second peak at +14 ms.
One drop, both beams, one chart. 23 drops at P3 (-4 mm), TOP (blue) and BOT (orange) overlaid in the same panel. The ~11 ms transit gap between TOP firing and BOT firing is the dual-beam architecture's velocity signal — directly visible. The two position-dependent contaminants of the chord measurement are also direct-readable: (i) the TOP shoulder approaching the trigger around −2 ms is the umbilical — the fluid filament still tethering the drop to the chamber tip; (ii) the bifurcated BOT peak around +11 ms / +14 ms is the backsplash trailing edge — particles crossing BOT after the drop body has cleared.
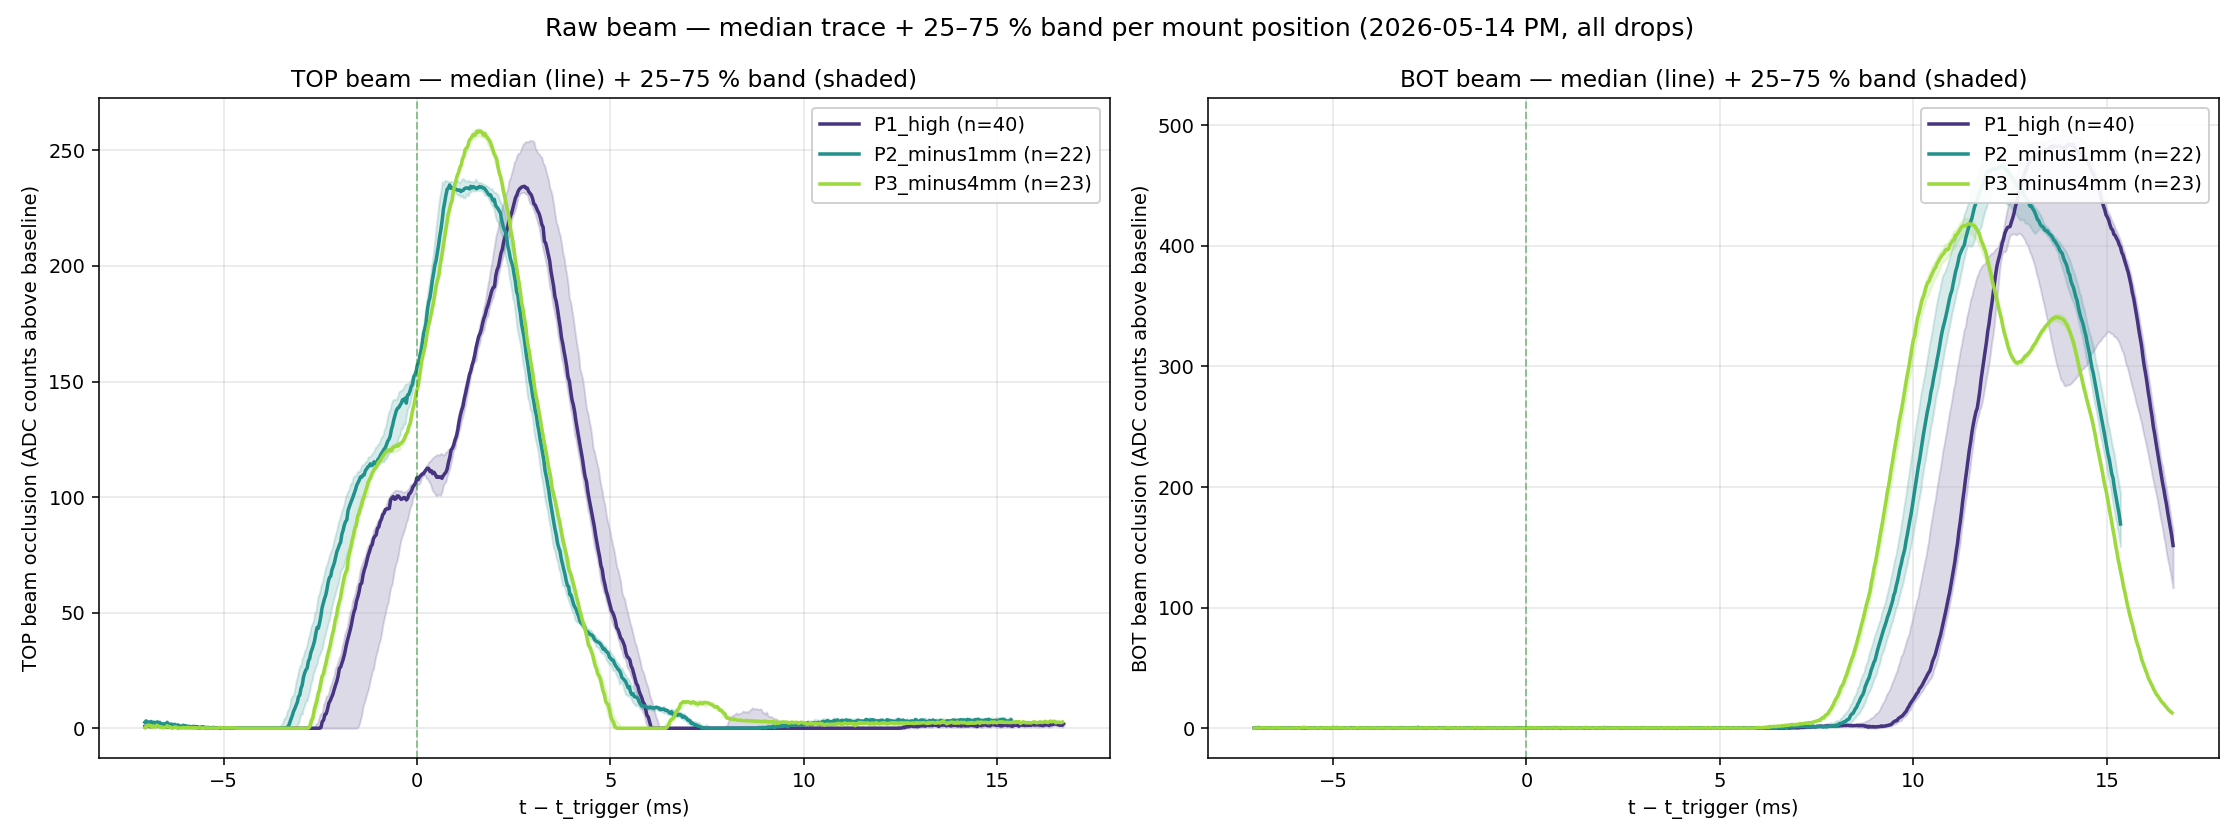
Median trace and 25 to 75 percent IQR band for each of three mount positions, TOP and BOT beams shown in separate panels. TOP medians overlap closely across all three positions. BOT medians shift systematically in timing — P1 canonical mount peaks first, P3 minus 4 mm peaks last with a visible second hump.
What position-dependence actually looks like. Median trace (line) + 25–75 % IQR band (shaded) per mount position, both beams. TOP shapes are largely position-invariant — the medians overlap closely across P1, P2, P3. BOT timing shifts systematically with mount geometry: P1 canonical peaks ~10 ms after trigger, P3 (-4 mm) peaks ~12 ms after trigger with a visible second hump. The §17 finding is that this BOT-shape variation is exactly what defeats a position-invariant chord-time → volume estimate. Bench n_drops: P1=40, P2=22, P3=23.
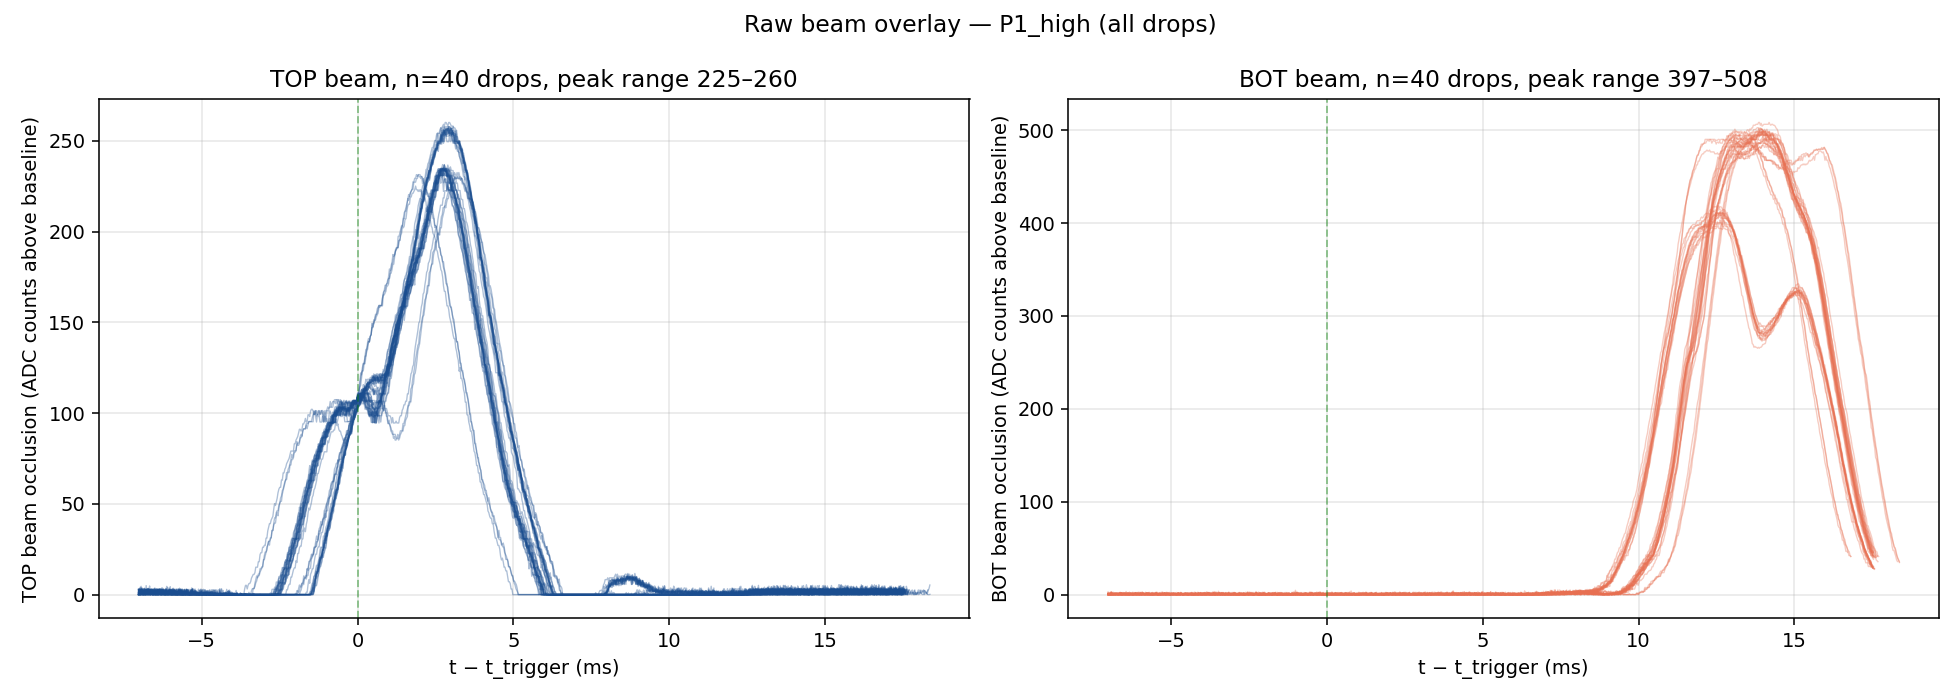
Two-panel overlay of 40 drops at the canonical V_50_05-era mount position. Left panel TOP beam peaks consistently around 225 to 260 ADC counts. Right panel BOT beam peaks 397 to 508 ADC counts with a small late-time hump visible after most drops.
40 drops at the canonical mount — the densest single-mount capture in the campaign. Per-channel peak ranges are tight (TOP 225–260, BOT 397–508; ±7 % and ±12 % around the median), meaning the device's per-drop response is repeatable; what makes V_CAL_K = 1.27 hold at this mount within ±30 % is the same data driving the predicted accuracy envelope above. Move the device 4 mm down the chamber (P3 above) and the BOT-shape family changes — that's what §17 is about.
Reproducibility

Synthetic error budget. The figure regenerates byte-identical from a fresh clone — no input data required. Fixed RNG seed (20260513, the bench date) keeps the prediction stable across re-runs until a parameter changes. The assumption table for every input is the docstring of scripts.error_budget.default_params; every value traces to a measurement, a datasheet, or a flagged placeholder.

cd analysis
docker compose up regenerate-error-budget

Validation pipeline (sanity-check figures + Bland-Altman). The same Dockerfile rebuilds the validation notebook against either the committed sample subset (data/sample/) — the cold-clone test — or the full bench dataset (data/raw/):

cd analysis
docker compose up regenerate-figures-sample   # cold-clone test (sample data)
docker compose up regenerate-figures          # full campaign data

Prerequisites. Docker + git installed locally. First build downloads ~300 MB of pinned Python + scientific-stack and takes ~3 min on a typical laptop. Pipeline source: analysis/notebooks/validation.ipynb. Dependencies hash-locked in analysis/requirements.txt (Python 3.12.7, pip --require-hashes). The same two commands run on every push to v2 in CI (.github/workflows/build-and-test.yml) on a fresh ubuntu-latest runner — green CI is the cold-clone reproducibility proof.

Honest weaknesses

What Rev-B does not resolve.

Six load-bearing limitations of the Rev-B validation, in order of impact on the conclusions. The full list of 17 is in docs/limitations.md. Each item below links to its full section. The position-dependence finding (§17) is the single most important Rev-C-relevant learning of the bench campaign.

  1. §17

    Position-dependence — V_CAL_K does not generalise across mount heights.

    Architectural

    On the afternoon of 2026-05-13 the device was mounted at four mount positions on the same drip chamber (same set, same fluid, same board). For the shipped mean-of-pulses algorithm, K_fit varied from 0.42 to 1.27 across positions (3× spread); across all eight algorithm variants trialled, K_fit spanned 0.42 to 1.98 (4.7× spread driven by mount geometry alone). Three contaminants of the chord measurement were isolated: an umbilical at TOP when mounted close to the drip orifice, backsplash at BOT when mounted close to the pool, and a threshold-vs-peak mismatch that shifts with the boot-cal baseline. Several algorithm variants (BOT_core only, TOP_low only, adaptive EMA, hybrid splash-detection) were tried; no single (algorithm, K) combination passed ±5 % at all positions. Conclusion: with Rev-B optics, the optical chord-time architecture does not deliver a position-invariant V_CAL_K. The two beams do deliver position-agnostic velocity and reliable drop counting — what they don't deliver is a position-invariant chord. The Rev-C path is named: a second pair of horizontally-separated beams, wider TOP-to-BOT separation, and TOP/BOT gain equalisation.

  2. §1

    Drops oscillate between oblate and prolate after detachment.

    Fundamental

    The chord-time architecture measures each drop's vertical extent and assumes a sphere. After detachment, drops oscillate between oblate and prolate as surface tension pulls them toward equilibrium (Rayleigh 1879); the beam catches each drop at an unpredictable phase. The run-mean bias averages out (V_CAL_K = 1.27 works on the run mean) but the per-run residual stays at ±30 %. A Rev-C front-end with horizontally-separated beam pairs would let firmware infer the oscillation phase.

  3. §2

    Two-orifice divergence invalidates per-drop matching.

    Methodological

    The device measures drops at the drip-chamber orifice; the scale captures mass at the end-of-tubing orifice. These two orifices have different geometry and surface-tension dynamics, so they drip at different rates with different drop sizes. The 2026-05-13 campaign saw end-orifice drop counts 1.5–2× the chamber-drop counts. Mass conservation still gives a clean shared quantity (total mass passed), so the valid ground truth at the per-drop level is V_true_chamber = mass / N_UART, not a per-drop pairing. tools/match_scale_drops.py is preserved as an exploratory diagnostic only.

  4. §3

    TOP-vs-BOT optical asymmetry (backsplash + intrinsic).

    Optical

    The TOP and BOT photodiodes report systematically different pulse widths for the same drop. The 2026-05-13 backsplash falsifiability test repositioned the device higher on the chamber; the BOT/TOP ratio fell from 1.75–2.50× to ~1.13×, suggesting the BOT photodiode sees a real splash-driven extension that the threshold-margin clips. A Rev-C optical front-end with the BOT beam moved further from the pool, plus TOP/BOT gain equalisation, would close the gap.

  5. §5

    V_CAL_K is fitted to the runs it is validated against.

    Methodological

    The scalar correction V_CAL_K = 1.27 is the unweighted mean of per-run k_pre across V_50_01..04. Reporting per-run residual against these four runs is therefore a self-consistency check, not an independent validation. V_50_05 (run after baking V_CAL_K into firmware) is the first generalisation check. Multi-day / multi-board / multi-fluid generalisation is out of Rev-B scope.

  6. §7

    Tethered 3.3 V supply.

    Scope

    The validation dataset is collected with 3.3 V supplied directly to MCU VDD via ST-Link, bypassing the TPS610981 boost converter from the single-cell battery design. The dataset validates the optical detection chain, sphere-model calibration, and dual-beam architecture. The field power chain (1 × AA Li-ion → boost → MCU) is deferred to Rev-C.

§17 — the per-drop optical signature.

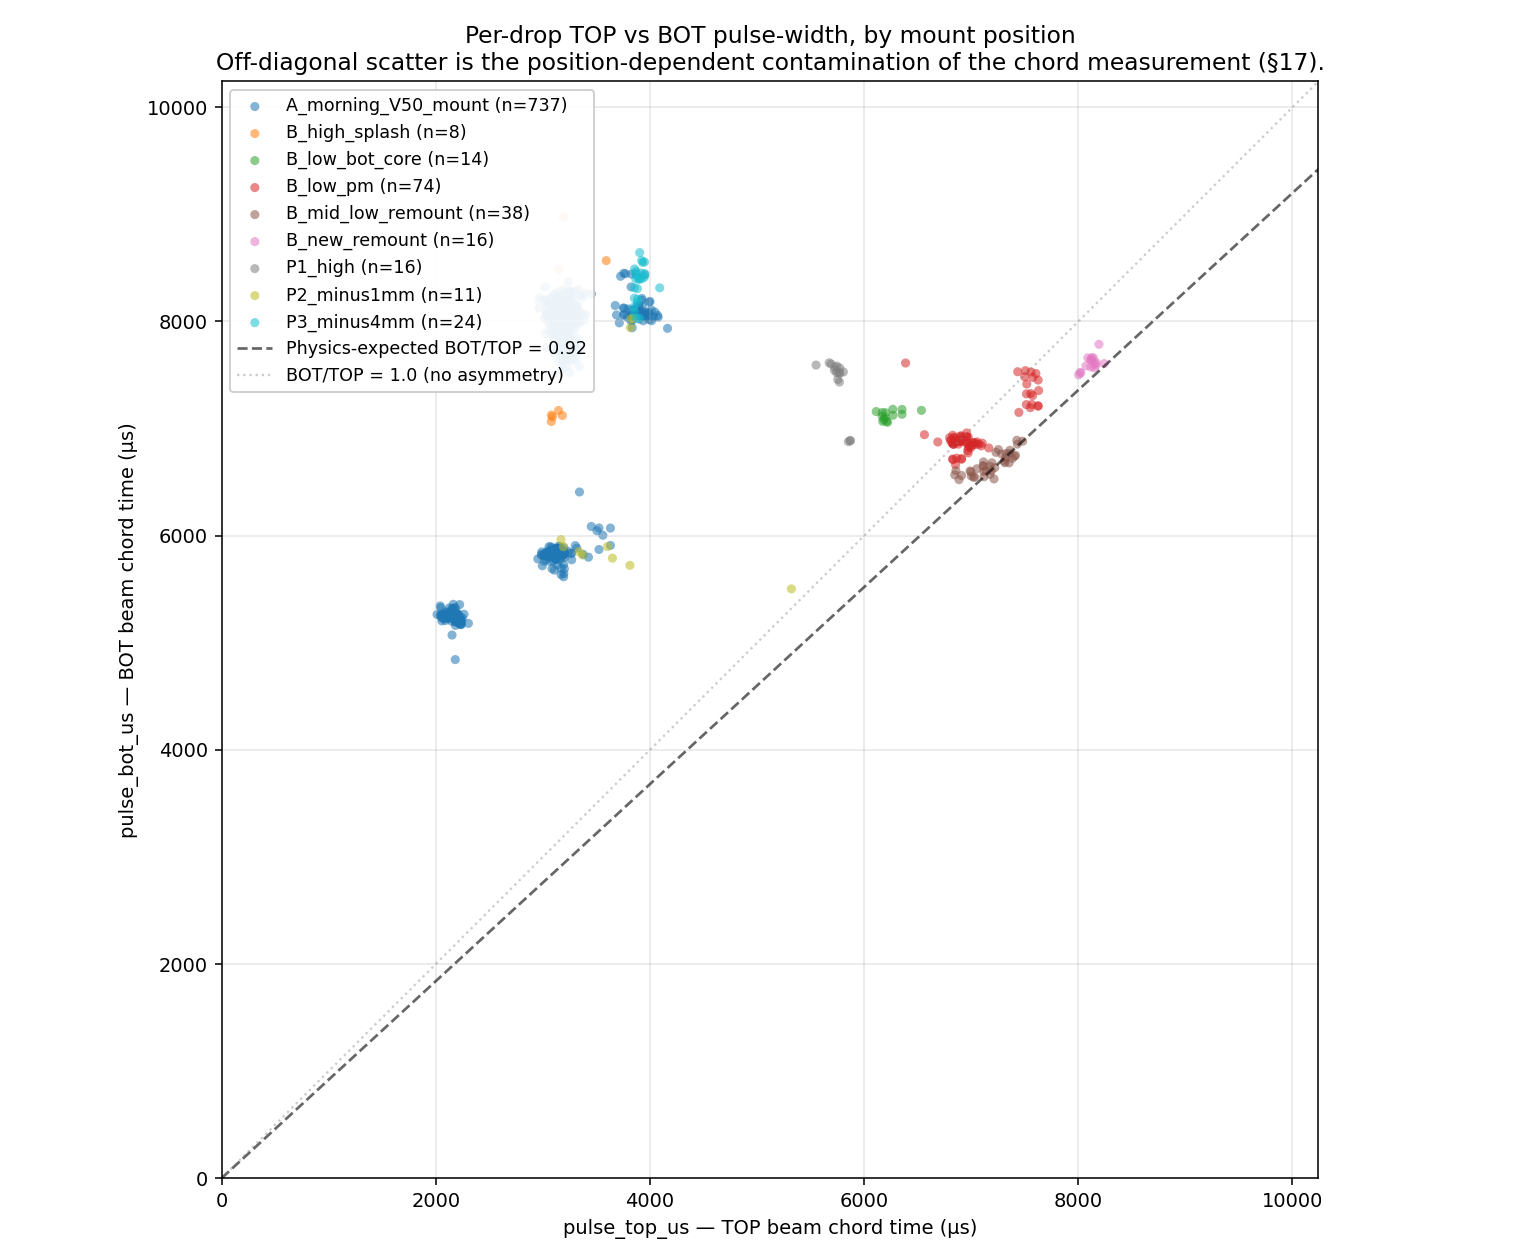
Per-drop scatter of TOP vs BOT pulse widths across the bench mount positions. The position-dependence finding's raw-waveform evidence is in the Analysis section above; this figure shows the derived 2D feature space the chord-time architecture's scalar V_CAL_K can't compress.

Square scatter plot of TOP beam pulse width versus BOT beam pulse width, both in microseconds, with one dot per drop colored by mount position. The physics-expected diagonal BOT/TOP equals 0.92 is drawn as a dashed line. All clusters sit above the diagonal and form distinct groups for different mount positions.
The same drop, different (TOP, BOT) signatures. Per-drop scatter of pulse_top_us versus pulse_bot_us, coloured by mount position. The physics-expected diagonal (BOT/TOP = 0.92, from gravity acceleration over the 10 mm pitch) is drawn for reference; every bench cluster sits above it (BOT pulse longer than physics predicts — backsplash + intrinsic asymmetry, §3). And the clusters separate by mount: A_morning_V50 around (3500, 5500–6000), B_high_splash around (4000, 8000), P3 minus 4 mm shifted again. The chord-time architecture's 2D feature space contains position information that a single scalar K can't absorb (§17).
Firmware

Alarm state machine.

Six states, two thresholds (±15% warning, ±25% alarm — per IEC 60601-2-24 §201.12). A nurse cannot disarm into Normal without explicitly Arming the device, preventing accidental silencing.

Boot Measuring Normal Armed Warning Alarm power on ≥5 drops user arm ±15% ±25%, >30 s recovery within tolerance
Build

Assembly.

Steps 0 / 6 Photo guide Rev-C deliverable
  1. 01 PRINT

    Print the case

    Two FDM-printed shells in ASA white — front and back.

    Parts ASA white filament
    Tools FDM printer
  2. 02 SOLDER ESD

    Solder the LCD + tactile switches

    EA DOGS164W-A LCD and two PTS647 tactile switches (left / right). Underlay a 3 mm spacer between the LCD and the PCB.

    Parts EA DOGS164W-APTS647 ×23 mm spacer
    Tools Soldering ironFlux
  3. 03 SOLDER POLARITY

    Build the satellite breakout

    Press the two IR LEDs into their bezels first, then solder both bezeled LEDs to the satellite PCB. Solder the AA battery leads onto the same board.

    FIG · 03A IR LED polarity — both channels
    LED+ LED− LONG anode SHORT cathode flat = cathode TOP CHANNEL LED+ LED− LONG anode SHORT cathode flat = cathode BOT CHANNEL
    Long leg → LED+ pad · short leg → LED− pad. Convention holds for both channels. The flat on the LED body marks the cathode side.
    Parts VSLY5940 IR LED ×2IR bezel ×2AA battery + leadsSatellite PCB
    Tools Soldering ironHelping hands
  4. 04 ASSEMBLY

    Attach the FFC cable

    Open the locking latch on J4 (6-pin FFC socket) on the main PCB, slide the ribbon in, close the latch. Repeat on the matching FFC socket on the satellite — no solder joint on either end.

    Parts 6-pin 0.5 mm FFC ribbon
    Tools Tweezers
  5. 05 MECH

    Seat the PCB in the front case

  6. 06 MECH

    Close the back case · insert the photodiodes

    Press each BPV10NF photodiode into its bezel, then push the bezeled photodiodes into the beam-aperture pockets in the back shell. Snap-fit the rear shell onto the front.

    Parts BPV10NF ×2IR bezel ×2Printed back shell
Architecture decisions

The choices behind the board.

Every non-trivial design choice is captured as a separate ADR in docs/decisions/. The cards below summarise the eight that matter most for the Rev-B submission. Click any card for the full record — context, alternatives considered, and the open risks at the time the decision was made.

Optical Architecture

Two-phase detection: dual-beam Phase 1 calibrates per-drop volume from velocity + pulse-width over ~10 drops, then LPTIM1 + COMP1 single-beam stop-mode for low-power continuous monitoring.

Read full ADR ↗

Comparator Simplification

External LMV331 comparator removed; STM32G071 internal COMP1 + DAC threshold replaces it. One IC dropped from the BOM, identified independently during schematic review.

Read full ADR ↗

Power Architecture

1× Li-ion AA + TPS610981 boost + a "Care Package" deployment model (alkaline fallback + external USB solar charger). Rejected 18650 cells, on-board charging, and integrated solar after thermal analysis.

Read full ADR ↗

Sensor Arm Alignment

Steel dowel-pin press-fit identified as the highest-leverage alignment mechanism (~40× tighter than FDM tolerance). Rev-B uses direct FDM geometry; press-fit deferred to Rev-C.

Read full ADR ↗

LED Duty Cycle

Phase 2 IR target 0.3 % (5 µs ON / 1.8 ms period). The earlier 0.1 % target was dropped — not physically achievable with deterministic drop detection across all drip sets.

Read full ADR ↗

Enclosure Material

ASA white, FDM-printed, snap-fit, IP54 design target. Chosen over PETG for UV resistance and over ABS for reduced FDM warping.

Read full ADR ↗

Battery Indicator

Low-battery symbol instead of a percentage. The Paleblue Li-ion AA’s flat 1.5 V discharge curve makes percentage misleading; a threshold flag at ~1.35 V is technically honest and clinically sufficient.

Read full ADR ↗

USB Interface Removal

USB replaced with a 5-pin UART debug header. USB lost its purpose when the BQ25185 + TPS631000 power stack was deferred; UART is sufficient for prototype-stage debug, BOOT0 preserves DFU access via a USB-UART bridge.

Read full ADR ↗
Closed by Rev-B

What Rev-B proved.

Three architectural conclusions Rev-B forced. The next student doesn't relitigate these — each is bench-evidenced in Limitations and the long form lives in docs/limitations.md.

  1. A single scalar V_CAL_K cannot generalise across mount positions.

    Architectural

    K required to fit gravimetric truth ranged 0.42–1.98 across 11 runs at four mount positions — same chamber, same drip set, same fluid, same board. Eight algorithm variants were trialled (TOP_low, BOT_low, BOT_core, TOP_core, mean-of-pulses, leading-half-pulse, hybrid splash-detector, EMA-adaptive); none passed ±5 % cross-position. Rev-C optics — not Rev-B firmware tweaks — are the path. See §17 in Limitations.

  2. The mean-of-pulses architecture cannot recover drop oscillation phase.

    Fundamental

    Drops oscillate between oblate and prolate after detachment (Rayleigh 1879); the chord-time architecture catches each one at an unpredictable phase. The run-mean bias averages out (V_CAL_K = 1.27 works on the run mean) but the per-run residual stays at ±30 %. This is a physics floor of the single-vertical-chord topology, not a tuning problem — recovering phase needs horizontally-separated beam pairs (Rev-C). See §1 in Limitations.

  3. Per-drop bench ground truth needs a closed end-orifice.

    Methodological

    The device measures drops at the drip-chamber orifice; the bench scale captures mass at the end-of-tubing orifice. Those two orifices have different surface-tension dynamics — the 2026-05-13 campaign saw end-orifice drop counts 1.5–2× the chamber-drop counts. Per-drop pairing against the scale is therefore invalid; the only valid bench ground truth is the run-mean V_true_chamber = mass / N_UART. Future bench rigs need a catheter-equivalent closed end-orifice for per-drop validation. See §2 in Limitations.